Technology & Innovation Blog
This page is an introduction to my Technology & Innovation blog. With this blog I hope to promote art & science as being born of the same continuum of communication and discovery that we all participate in.
Much of my passion for Teaching & Learning comes from a broad exposure to the liberal arts, and a personal love of learning all things. But if I could teach only one thing to someone, most important would be to never let physical separations of knowledge prevent mixing ideas and things together to see what can be invented.
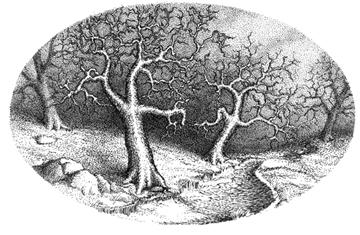
Stipple Pen & Ink Drawing
For years I worked in traditional fine art mediums; printmaking on intaglio presses, painting on canvass, drawing with ink on paper. One technique I like using is the “stipple” effect with pen & ink. The technique involves hand-rendering thousands of tiny dots to create shapes and tonal ranges. Here’s an image of mine that uses that technique, which was published in a novel:
It is essentially a way of printing ink pixels on a page without needing a computer or ink-jet printer. It is a time consuming technique that takes patience. But the time it takes is only an issue if you compare it to the time it takes to press the “print” button from your image editing program.
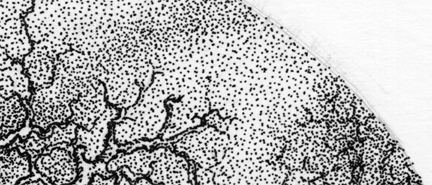
Closeup – Stipple Pen & Ink Drawing
If you count up all the actual time it takes to initially create a digitized image from scratch or scan something and then add the time it takes to tweak it, and color correct it for the printout, troubleshoot color calibration, etc., to make it perfect, you may find the stipple technique relaxing and Zen-like as I do.
Along with these types of drawings I’ve created other illustrations and artwork using a variety of mediums. As computer graphics evolved, and I became interested in the digital realm, more than once I was asked the question “What do your drawings have to do with your interest in technology?” The question itself has to be turned on its head to find the answer. “In the real world, how could art and science not be related if we humans are the ones doing both?
Many have written about the similarities between artists and scientists, but those works are usually apologetic or anecdotal. I prefer to encourage people to identify creativity holistically, systematically, everywhere it occurs, using abstract evaluators. “Is it productive or destructive?”. “Does it compliment or contrast something else”. “Does it resonate, or ring true with anyone?” Emphasizing common language around abstract evaluators is portable, mobile, agile, and more socially inclusive. New technologies in all aspects of art, communication and research now easily facilitate multidisciplinary work. It is assisting new generations of learners and makers to de-construct the physical and cultural walls that have traditionally separated intellectual pursuits or ways of knowing and learning.
Yet educational reform at the institutional level is slow moving, since most schools still separate pursuits by “topic” or traditional (antiquated) notions about what constitutes valid domain work, how job descriptions should be written, or what the people who fill those jobs should look like or say or do. One of the most interesting areas where new technology has been fostering innovation between previously separate domains is in Bioinformatics. The two areas of biology and computer science have always been somewhat related through general Information Technology being integrated into research from the very beginnings, but the only recent maturity of certain standards, technologies, and tools have greatly advanced the rate and scope of collaboration between those fields.
Photo 51 X-Ray diffraction of DNA molecule
As a visual artist my first reaction to beginning to learn more biology was; “…hey stop talking about enzymes and let me see the process!” I began to be fascinated by the way biology communicates and functions. From a purely visual and illustrative point of view, even very early technology was able to help us visualize very small things to make huge discoveries.
Here is one of the most important images to ever be created:
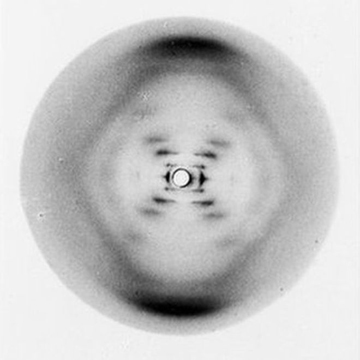
Without this image (Rosalind Franklin et al), Crick & Watson of DNA discovery fame may have doubted their progress or ventured into a different and unfruitful area of investigation. Seeing a visual representation of what existed at the molecular level was crucial. Today, understanding what is not seeable with the naked eye or optical tools is also very important, since much of the complex ways biology communicates systemically is unknown and may never lend itself to being captured in a simple two dimensional representation.
Analysis of raw captured data has become the new microscope, and a way to test assumptions about natures’ systems. So visualizing the data in multiple dimensions is crucial, and one of the best ways to look for areas of interest, or communicate information within the data.
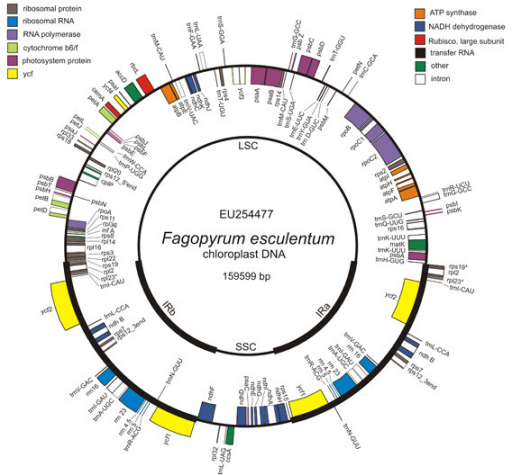
Gene Mapping
This is where traditional visualizing best practices meet high-tech graphics, machine learning and big data. One type of visualization for genome data is seen here in a gene map, which helps researchers identify and communicate gene sequencing and DNA related data.
Despite this being a 2-Dimensional image, the analysis it represents has several dimensions. There is a spatial dimension of the 3rd kind relating to the areas of the gene being located, and the 4th dimension of time is represented by both the computational loops used to generate the data, and the linear area of the genome which can be conceptually considered to be a timeline. The result is a very rich representation of multiple processes and data types.